Hook Rate Benchmarks: What 30.7% Average Means and How Real Faces Beat It
TikTok average hook rate is 30.7%, Meta baseline 20-25%. Learn the benchmarks that matter and how real creator faces push you into top-quartile performance.
If you are running video ads and not tracking hook rate, you are flying blind on the single metric that determines whether anyone sees your message at all. Tuff Agency's analysis across 11 TikTok accounts puts the platform average at 30.7%. Vaizle's 2025 review places Meta's baseline at 20-25%. And Zeely's meta-analysis of optimized Meta campaigns shows top performers reaching 30-50%.
Those ranges represent the difference between burning budget and building pipeline. Here is what the benchmarks actually mean and how real human faces move the needle.
What Hook Rate Actually Measures
Hook rate is the percentage of viewers who watch past the first few seconds of your video. The exact definition varies by platform (TikTok typically uses 2-3 seconds, Meta often measures at 3 seconds), but the concept is the same: of all the people who were served your ad, how many gave it more than a passing glance?
This is not vanity metric territory. Facebook's own data shows that nearly half of viewers who stay for 3 seconds will continue watching for 30 seconds. Hook rate is not just measuring attention. It is measuring the threshold event that predicts downstream engagement, message delivery, and conversion.
When TikTok reports that 63% of top-performing ads deliver their core message within 3 seconds, they are describing the same phenomenon from the other direction. The ads that win are the ones that use the hook window to both capture attention and begin communicating value.
 Hook rate is the single metric that predicts whether your message gets delivered at all.
The Benchmarks, Platform by Platform
TikTok: 30.7% Average, 40-45% Top Quartile
Tuff Agency's analysis of 11 TikTok ad accounts provides one of the more grounded benchmarks available. The average hook rate across accounts was 30.7%. Top-quartile performers consistently hit 40-45%.
The spread here is significant. A campaign running at 25% hook rate is below average and paying a substantial premium in wasted impressions. A campaign at 42% is in the top tier and extracting dramatically more value from the same spend.
What separates the tiers? The research points consistently to what happens in the first frame. The neuroscience of the 1.5-second window shows that face detection and trust evaluation happen before conscious processing. Ads that lead with a real human face enter this process with an advantage that text overlays and product shots simply cannot replicate.
Meta: 20-25% Baseline, 30%+ Top Performers
Vaizle's 2025 review of Meta ad performance places the baseline hook rate lower than TikTok, at 20-25%. This makes sense given the different scroll behaviors on Facebook and Instagram. Meta feeds tend to include more static content, which changes the context in which video ads compete for attention.
The top-performer threshold on Meta is 30%+. Zeely's meta-analysis of optimized campaigns shows that well-tested creative can push into the 30-50% range. The gap between baseline and optimized is even wider on Meta than on TikTok, which suggests the opportunity cost of weak creative is higher on Meta.
The Cross-Platform Takeaway
Regardless of platform, the pattern is the same: there is a large, actionable gap between average and top-quartile hook rates. And the most consistent lever for closing that gap is what the viewer's brain encounters in the first frame.
Why Real Faces Move the Needle
SendShort's analysis of six brands found that human presenters combined with native overlays added 5-10 percentage points to hook rate. On a Meta baseline of 20-25%, that is the difference between below-average performance and top-tier results.
This is not surprising when you consider the neuroscience. The 170-millisecond face detection response happens well within the hook window. The brain is not evaluating your headline or your color palette in those first milliseconds. It is scanning for a face and making a snap trust judgment.
Animoto's 2026 data adds context: 78% of consumers say they trust videos featuring real people. When the hook window is your only chance to establish trust, starting with what viewers already trust is not creative instinct. It is statistical optimization.
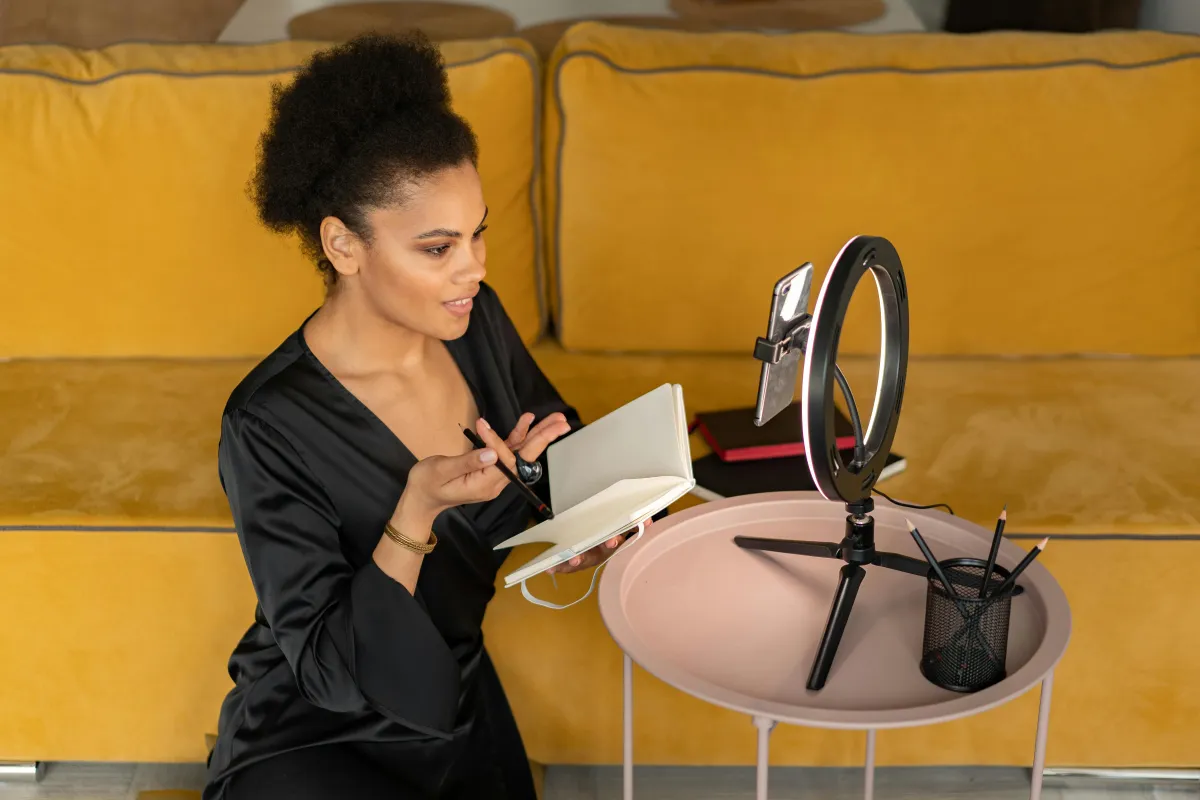
 Photo by Nathana Rebouças on Unsplash
Real creators provide the face-first opening that neuroscience shows the brain is scanning for.
Photo by Nathana Rebouças on Unsplash
Real creators provide the face-first opening that neuroscience shows the brain is scanning for.
The AI Hook Rate Problem
Runway's own "Turing Reel" study (2026) showed that 90% of participants could not reliably distinguish Gen-4.5 video from real footage. But detection accuracy for human-related content (faces, hands, actions) was higher: 58-65%.
This is exactly the content category that dominates hook performance. The videos most likely to be detected as AI are the videos that rely on human presence, which are the videos with the highest hook rate potential.
It creates an awkward tradeoff for AI creative. You can use AI for non-human content (landscapes, product renders, abstract visuals) where detection rates are lower, but you lose the face-first advantage that drives hook rate. Or you can put AI faces in the first frame, and you risk triggering the subconscious detection systems that the University of Sydney documented: 54% neural detection rate versus 37% conscious identification.
The subconscious gap is the problem. Even when viewers do not consciously identify the face as AI, their brain's pre-attentive processing may still produce the subtle aversion that translates to a scroll-past rather than a scroll-stop.
Reading Your Own Hook Rate Data
Benchmarks are useful as context, but your own data tells a more specific story. Here is how to use hook rate diagnostically.
Below 15% on Meta or 20% on TikTok: Your opening frame is actively repelling viewers. This usually means the first frame is a logo, text card, or product shot with no human element. The fix is structural: lead with a face.
15-25% on Meta or 20-30% on TikTok: You are in the average range. Your creative is not failing, but it is not competing. This is where testing different opener styles yields the biggest marginal returns. SendShort's data suggests the human presenter plus native overlay combination is the highest-leverage change.
25-35% on Meta or 30-40% on TikTok: You are performing above average. At this level, optimization shifts from structural changes (what type of opening) to execution refinement (which expression, which emotion, which creator). This is where having a library of diverse creator reactions to test against becomes a competitive advantage. A video marketplace like LatinaUGC — with a clip library of reaction videos from Latin creators and lifetime commercial rights included — gives brands the raw material to run this kind of systematic testing without booking individual shoots.
35%+ on Meta or 40%+ on TikTok: Top-quartile performance. The game here is maintaining consistency across creative refreshes and preventing fatigue. Having access to multiple creators who can deliver the same hook style ensures your top performers do not degrade as you scale.
The Compound Effect of a Better Hook
Hook rate improvements do not just improve one metric. They cascade through your entire funnel.
Industry data shows 60% more total retention when brands nail the opening. A 10-point hook rate improvement does not just mean 10% more people see your ad. It means more people watch longer, which means more message delivery, which means higher downstream conversion.
Consider the math on a campaign spending $10,000/month. At a 20% hook rate, 2,000 out of every 10,000 impressions produce engaged viewers. At a 30% hook rate, 3,000 do. That is 50% more engaged viewers for the same spend, before accounting for the retention and conversion improvements that follow from stronger engagement.
The brands reaching Zeely's 30-50% optimized range are not just running better ads. They are running a fundamentally more efficient media operation.
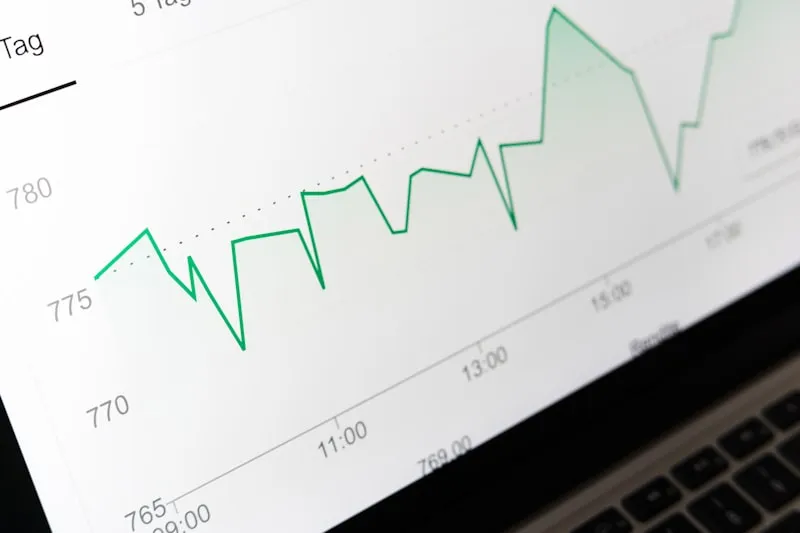 A 10-point hook rate improvement compounds through every downstream metric.
From Benchmarks to Action
The benchmarks are clear: average is not good enough, the gap to top-quartile is large, and the most consistent lever is putting a real human face in the first frame. For brands without an in-house creator team, sourcing authentic content through a UGC marketplace — where real Latin creators are available on demand — is the most direct path from benchmark-average to top-quartile performance.
The testing framework for real-creator hooks provides a step-by-step process for moving from wherever you are now to top-quartile performance. But the starting point is the same for everyone: get real faces into your opening frames and measure what happens.
Real creators. Real emotion. Ready to test in your next campaign. Browse the Catalog →
Sources
- Tuff Agency, "TikTok hook rate analysis (11 accounts)"
- Vaizle, "Meta ads hook rate benchmarks," 2025
- Zeely, "Meta-ads hook rate optimization analysis," 2025
- SendShort, "Hook rate analysis (6-brand study)"
- Facebook, "3-second to 30-second retention data"
- TikTok, "Top-performing ads 3-second message delivery review"
- Animoto, "State of Video 2026 Report," January 2026
- University of Sydney, "EEG detection of deepfake faces," 2022
- Runway, "The Turing Reel study," 2026
- Industry data, "60% retention improvement from strong openings"