The UGC Testing Framework: How to Find Winning Creative in 14 Days
A structured UGC creative testing framework to isolate winning emotions, creators, and formats in 14 days with clear decision criteria.
Most brands test UGC the same way they test everything else: throw three versions into an ad set, pick the winner after a week, and move on. That approach leaves massive performance on the table because it conflates variables. Was it the creator that won, or the emotion? The hook, or the format?
UGC ads deliver 4x higher CTR at 50% lower CPC when they work (Multiple sources). The gap between "when they work" and "on average" is your testing methodology.
Here's the framework we use to find winning creative in 14 days, with enough statistical confidence to scale.
Why Standard A/B Testing Fails for UGC
Traditional A/B testing assumes you're comparing two versions of the same thing. Change the headline, measure the lift. Clean variable isolation.
UGC doesn't work like that. A single UGC clip bundles multiple variables together: the creator's face, their emotional delivery, the format (reaction vs. GRWM vs. testimonial), the hook moment, the pacing, the audio. When you test Clip A vs. Clip B and Clip A wins, you don't know which of those variables drove the result.
This matters because the thing that won might not be the thing you think. Maybe the "winning" clip had an inferior emotion but a more compelling first frame. Maybe the creator's face triggered stronger trust signals (the brain locks onto eyes and expressions in under a second, per InFront Marketing research) while the actual emotion was wrong for your audience.
Without variable isolation, you can't replicate wins. You just get lucky sometimes.
The Four Variables That Matter
After analyzing hundreds of UGC ad campaigns, the variables that most consistently predict performance come down to four:
1. Emotion. Surprised, skeptical, delighted, tearful, excited. Different emotions serve different campaign objectives. Surprise works for hooks. Skepticism-to-conviction works for consideration. Delight works for retention.
2. Creator. Not just "who," but their expressiveness, demographic match to your audience, and on-camera energy. Two creators delivering the same emotion can produce dramatically different results. Latin creators, for example, often bring a cultural expressiveness that amplifies emotional intensity — which matters significantly at the hook stage.
3. Format. Reaction clip, GRWM, unboxing, testimonial, before/after. The container changes how the emotion lands.
4. Hook. The first 1-3 seconds. 63% of top-performing ads deliver their core message in this window. You can test different hook approaches (big reaction vs. text overlay vs. pattern interrupt) independently of the other variables.
The 14-Day Testing Calendar
Days 1-2: Emotion Test
Goal: Find which emotion resonates with your audience.
Setup:
- Select ONE creator (controls for face/delivery style)
- Select ONE format (e.g., reaction clip)
- Produce 4-5 clips with different emotions: surprise, excitement, skepticism, delight, curiosity
- Same product, same framing, same duration range (5-8 seconds)
- Run all as hook clips in a single campaign with equal budget distribution
Decision metric: Hook rate (3-second view rate). This is the cleanest signal for emotional resonance in the first frame.
Minimum spend: Enough to generate 1,000+ impressions per variant. On Meta, that's roughly $15-25 per clip at typical CPMs. On TikTok, slightly less.
Day 2 decision: Rank emotions by hook rate. Your top 2 emotions advance.
Days 3-5: Creator Test
Goal: Find which creator best delivers your winning emotion.
Setup:
- Lock in your top emotion from the previous test
- Lock in the same format
- 3-4 different creators, all delivering the same emotion
- Same brief, same product, same duration
Decision metric: Hook rate AND hold rate (percentage watching past 50%). A creator might grab attention but not hold it, or vice versa.
Day 5 decision: Your top 1-2 creators advance.
Days 6-8: Format Test
Goal: Find which format best carries your winning emotion + creator combination.
Setup:
- Lock in your winning emotion and top creator
- Test 3-4 formats: reaction clip as hook, GRWM with product, testimonial, unboxing
- Each format gets the same media budget
Decision metric: This is where you shift from hook rate to downstream metrics. CTR, CPC, and if your pixel is mature enough, cost per action. Different formats have different length profiles, so hook rate alone won't give you a fair comparison.
Day 8 decision: Your top 1-2 formats advance.
Days 9-12: Hook Optimization
Goal: Maximize the opening seconds of your winning combination.
Setup:
- Lock in emotion, creator, format
- Test variations of the first 1-3 seconds: different opening expressions, text overlay vs. no text, audio hook vs. visual-only, zoom levels
- This is where the hook rate testing framework becomes granular
Decision metric: Hook rate and CTR combined. You want the variant that both stops the scroll and drives the click.
Day 12 decision: Your optimized hook + creative combination is your scaling candidate.
Days 13-14: Validation and Scale Prep
Goal: Confirm the winner holds up at higher spend.
Setup:
- Take your winning combination and run it at 2-3x the test budget
- Monitor for performance stability (does the hook rate hold? Does CPA stay consistent?)
- If performance holds within 15% of test results, you have a scaling candidate
Day 14 decision: Scale or iterate. If performance degrades at higher spend, go back to your second-place variants and test those at scale.
Sample Sizes and Statistical Confidence
The enemy of fast testing is waiting for statistical significance on small differences. Here's how to move fast without fooling yourself.
For hook rate tests (Days 1-2, 9-12): You need roughly 1,000 impressions per variant to detect a 5+ percentage point difference in hook rate with reasonable confidence. At a 30% baseline hook rate (the TikTok average per Tuff Agency data), you're looking for variants that hit 35%+ or drop below 25%.
Don't agonize over the difference between 31% and 33%. That's noise. Look for clear separations.
For CTR and CPC tests (Days 6-8): You need more data here. Aim for at least 500 clicks per variant before making decisions. At a 1% CTR and $1 CPC, that's $500 per variant. Adjust based on your actual benchmarks.
For CPA tests (Days 13-14): You need enough conversions to be meaningful for your business. If your CPA is $50, you need at least 20-30 conversions per variant to see a real pattern. That's $1,000-1,500 per variant at validation stage.
The practical shortcut: If one variant is beating another by 20%+ on the primary metric after reaching minimum sample size, call it. You don't need 95% statistical significance for creative testing. You need directional confidence and speed.
What "Winning" Looks Like at Each Stage
Emotion Test Winners
- Hook rate 5+ points above the median of your test group
- Example: If your five emotions test at 28%, 31%, 35%, 29%, 33%, your winners are 35% and 33%
Creator Test Winners
- Hook rate within 2 points of best AND hold rate in top half
- A creator with 34% hook rate and 45% hold rate beats a creator with 36% hook rate and 30% hold rate. You need both attention capture and retention
Format Test Winners
- Best CTR-to-CPC ratio
- A format with slightly lower CTR but significantly lower CPC often wins on ROI
Hook Optimization Winners
- Highest hook rate that maintains CTR
- Sometimes an extreme hook (big reaction, jarring pattern interrupt) inflates hook rate but attracts low-intent viewers. CTR is the check on that
Building Your Testing Library
Each round of testing produces losers that aren't worthless. They're data.
Keep a testing log with these fields for every variant:
- Emotion: What was the target emotion?
- Creator ID: Which creator delivered it?
- Format: Reaction, GRWM, testimonial, etc.
- Hook approach: What happened in the first 3 seconds?
- Hook rate: 3-second view percentage
- Hold rate: 50% view percentage
- CTR and CPC: Click performance
- CPA (if available): Conversion performance
- Notes: Why you think it won or lost
After 2-3 rounds of this framework, patterns emerge. You'll find that your audience responds to specific emotions regardless of creator. Or that one creator outperforms across all emotions. These patterns are worth more than any single winning ad because they let you produce winners predictably.
Scaling Winners Without Killing Them
The most common failure point is scaling. A clip that performs at $50/day often degrades at $500/day because the audience pool widens and the targeting loosens.
Three rules for scaling UGC winners:
-
Scale budget by 20-30% per day, not 200% overnight. Gradual scaling lets the algorithm adjust delivery without shocking the system.
-
Produce variations of your winner, not copies. Same creator, same emotion, slightly different delivery. Same hook approach, different creator. This gives the algorithm fresh creative that carries the same performance DNA.
-
Set a fatigue trigger. When hook rate drops 20% from its peak, or CPA rises 30% from its baseline, it's time for a new variant. Creative fatigue is the number one performance killer for UGC ads, and the only defense is a pipeline of tested variants.
The Math on Testing Investment
Running this 14-day framework costs roughly $1,500-3,000 in media spend, depending on your CPMs and how many variants you test per round.
That sounds like a lot until you compare it to the alternative: spending $10,000+ scaling a "gut feel" creative that turns out to underperform by 40%.
UGC ads deliver 4x higher CTR at 50% lower CPC when optimized. The delta between an untested UGC ad and a tested one is often larger than the delta between UGC and traditional creative in the first place. Testing is where the real ROI lives.
Start with the Clips, Not the Hypothesis
One last principle: the best testing frameworks start with a library of options, not a single bet.
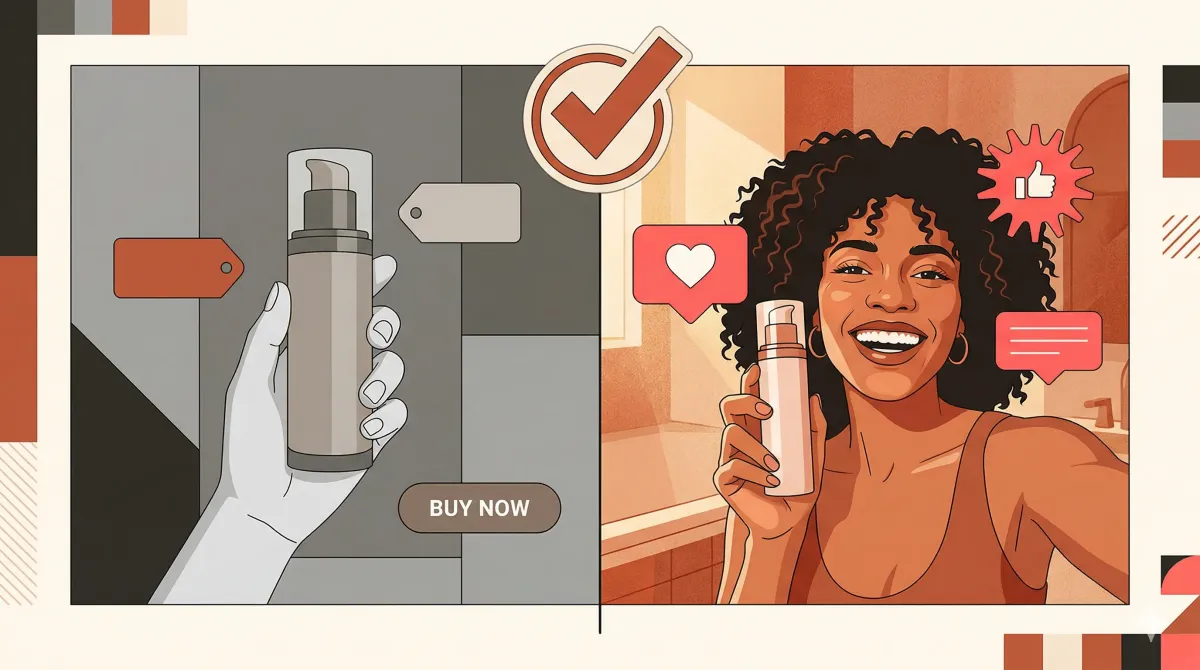
If you're commissioning one custom clip and hoping it works, you're not testing. You're gambling. Real testing requires enough raw material to isolate variables, which means starting with a clip library of reaction clips and testimonials across multiple emotions, creators, and formats. Platforms like LatinaUGC make this practical: a curated video library of authentic content from Latin creators, searchable by emotion, so you can build your test batch in minutes rather than waiting weeks for custom deliveries.
Real creators. Real emotion. Ready to test in your next campaign. Browse the Catalog →
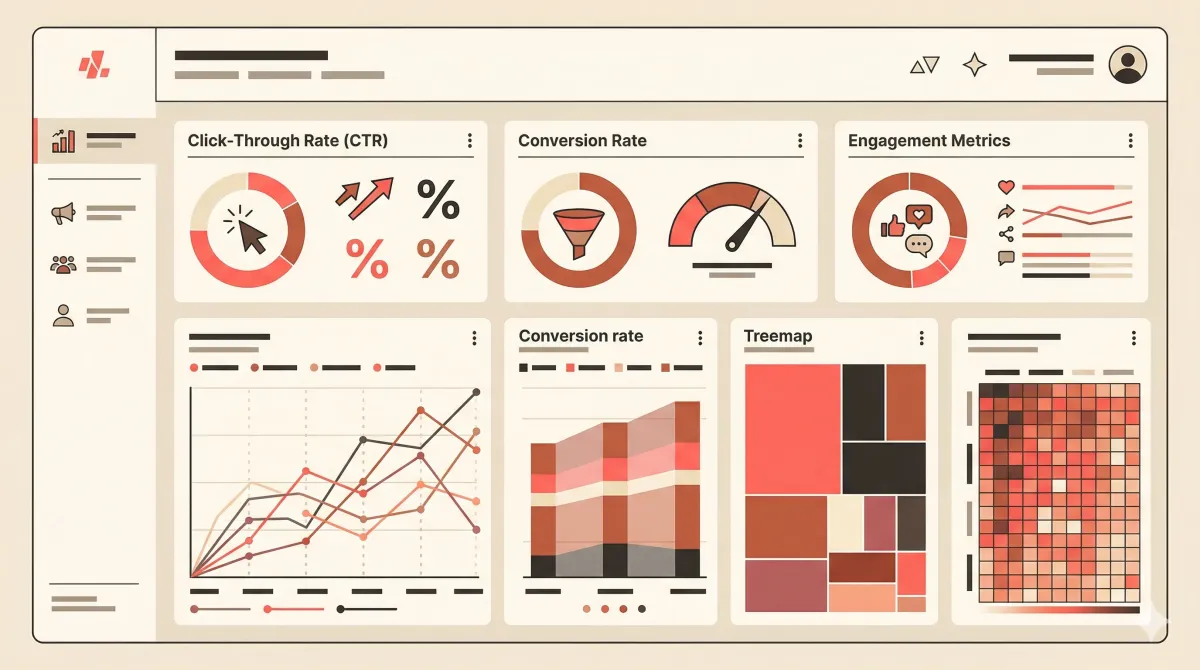 Structured testing turns creative selection from guesswork into a repeatable system.
 Isolate one variable at a time: emotion, creator, format, then hook.
Sources
- Animoto, "State of Video 2026 Report," January 2026
- Tuff Agency, "TikTok Hook Rate Benchmarks (11 accounts)," Recent
- InFront Marketing, "Neuroscience of Visual Attention in Advertising," Recent
- TikTok, "Top-Performing Ad Creative Review," Recent
- Industry data on UGC ad performance (4x CTR, 50% lower CPC), Multiple sources, Recent